Brexit, for once some facts.
- Thread starter flecc
- Start date
Double whammy. Getting covid and having to spend Christmas with relatives. The unfortunate bastards.Dear oh dear, so many going sick with Omicron that there's huge staff shortages disrupting hospitals, care homes, railways etc.
What an amazing coincidence that it's happened just in time to spend Christmas day with their families.
.
BTWDouble whammy. Getting covid and having to spend Christmas with relatives. The unfortunate bastards.
HAPPY BIRTHDAY! (for tomorrow)
Thank you.BTW
HAPPY BIRTHDAY! (for tomorrow)
Why did your Dad do such a big steaming Covid on us?Thank you.
Last edited:
Looking good for 2027 years of age.Thank you.
Christmas Message
https://twitter.com/RussInCheshire
He sees you when you're sleeping
He knows when you're awake
He knows if you've been bad or good
Mark Zuckerberg is his name!

https://twitter.com/RussInCheshire
He sees you when you're sleeping
He knows when you're awake
He knows if you've been bad or good
Mark Zuckerberg is his name!
No he didn't son, that was like a Brexit promise, Fake News!
Weed is one of mine
But don't worry, I've put your name down for a place by a smoky fire!
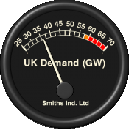
Looks like they are doing everything they can to avoid burning gas. Nuclear is as high as it can go (between orange and red), wind is over 40%:
 www.gridwatch.templar.co.uk
And people haven't really started cooking seriously. Demand will only go up, I suspect. And even now, frequency is a bit low.
G. B. National Grid status
And people haven't really started cooking seriously. Demand will only go up, I suspect. And even now, frequency is a bit low.
Do not fold spindle or mutilate - except:

 www.bbc.co.uk
I found this one of the most pleasant to watch little videos in a long time. Super simple. No big story. But in its own way, fascinating, and soothing. And not far away.

The incredible art of paper folding
Artist Polly Verity loves the look and feel of paper and has been "lost in its landscape" for years.
I found this one of the most pleasant to watch little videos in a long time. Super simple. No big story. But in its own way, fascinating, and soothing. And not far away.
Amazing....Do not fold spindle or mutilate - except:

The incredible art of paper folding
Artist Polly Verity loves the look and feel of paper and has been "lost in its landscape" for years.www.bbc.co.uk
I found this one of the most pleasant to watch little videos in a long time. Super simple. No big story. But in its own way, fascinating, and soothing. And not far away.
Merry Christmas everybody...
earliNews
And, I do mean everybody...
I'm sure it can manage a bit more.Nuclear is as high as it can go (between orange and red)
There are precedents, Windscale, Three MIle Island, Chernobyl, Fukushima.
.
Wind can give a bit more as well! Bella, Darcy, Arwen, Barra, ...I'm sure it can manage a bit more.
There are precedents, Windscale, Three MIle Island, Chernobyl, Fukushima.
.
Merry Christmas everybody.
Region
Showing a table of the data
| Area |
|---|
DeathsRate per 100,000 population
| Yorkshire and The Humber | 13,092 | 236.9 |
| West Midlands | 15,413 | 258.5 |
| South West | 8,228 | 145.4 |
| South East | 19,076 | 207 |
| North West | 20,751 | 281.7 |
| North East | 7,130 | 266 |
| London | 17,355 | 192.8 |
| East of England | 14,923 | 238 |
| East Midlands | 11,747 | 241.4 |
Only the South West managed a lower total of deaths per 100,000 than London over the Covid two years. The other regions mostly much higher, despite their very much higher vaccination rates.
All Covid deaths data from this .gov.uk link
.
Bikini?I'm sure it can manage a bit more.
There are precedents, Windscale, Three MIle Island, Chernobyl, Fukushima.
.
Unless 10% of those Londoners went home to Manchester bto die.Merry Christmas everybody.
Region
Showing a table of the data
Area
DeathsRate per 100,000 population
Yorkshire and The Humber
13,092
236.9
West Midlands
15,413
258.5
South West
8,228
145.4
South East
19,076
207
North West
20,751
281.7
North East
7,130
266
London
17,355
192.8
East of England
14,923
238
East Midlands
11,747
241.4
Only the South West managed a lower total of deaths per 100,000 than London over the Covid two years. The other regions mostly much higher, despite their very much higher vaccination rates.
All Covid deaths data from this .gov.uk link
.


